Pilots often quip that the drive to the airport is the most perilous part of any flight. When boarding a commercial airliner, this statement holds weight. You’re statistically more likely to be struck by lightning than be involved in a commercial airline accident. But how does air travel in general compare? Specifically, Is Air Travel Safer Than Driving, considering all facets of aviation?
This article dives deep into the safety statistics, comparing commercial airlines, general aviation (GA), and driving, providing you with a clear understanding of the risks involved.
General Aviation vs. Driving: Unveiling the Risks
Comparing the safety of driving and flying in general aviation (GA), which includes private planes and personal flights, is complex. National safety agencies use different metrics to report accident rates for air and road travel.
The National Highway Traffic Safety Administration (NHTSA) measures accidents per 100 million vehicle miles traveled. In 2021, NHTSA reported over 6.1 million crashes and 1.37 fatalities per 100 million vehicle miles.
Conversely, the National Transportation Safety Board (NTSB) tracks accidents per 100,000 flight hours. In 2021, the NTSB reported 12,368 general aviation crashes and 0.95 fatalities per 100,000 flight hours.
To provide a fair comparison, we need a common metric.
A 2020 study offers a solution, revealing 0.6 to 0.7 fatal car crashes per million hours driven. The rate varies based on age, ranging from 1.05 for younger drivers to 0.45 for older drivers.
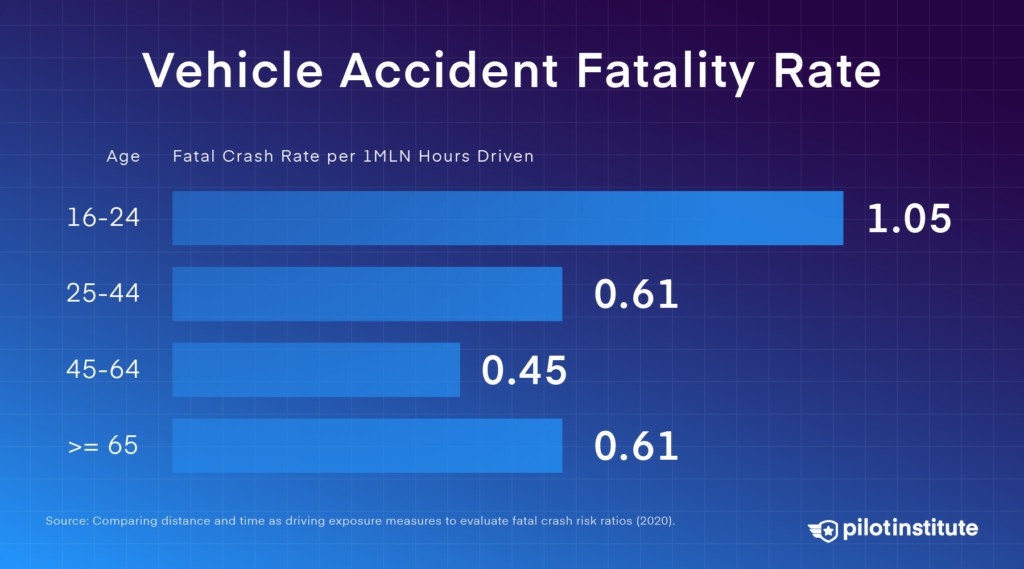 Vehicle accident fatality rate by age.
Motorcycle accident fatality rates are significantly higher. NHTSA data shows approximately 16 to 18 fatal motorcycle accidents per million hours ridden, about 27 times more frequent than car accidents per vehicle mile.
So, how does GA stack up against these numbers?
Overall General Aviation Safety
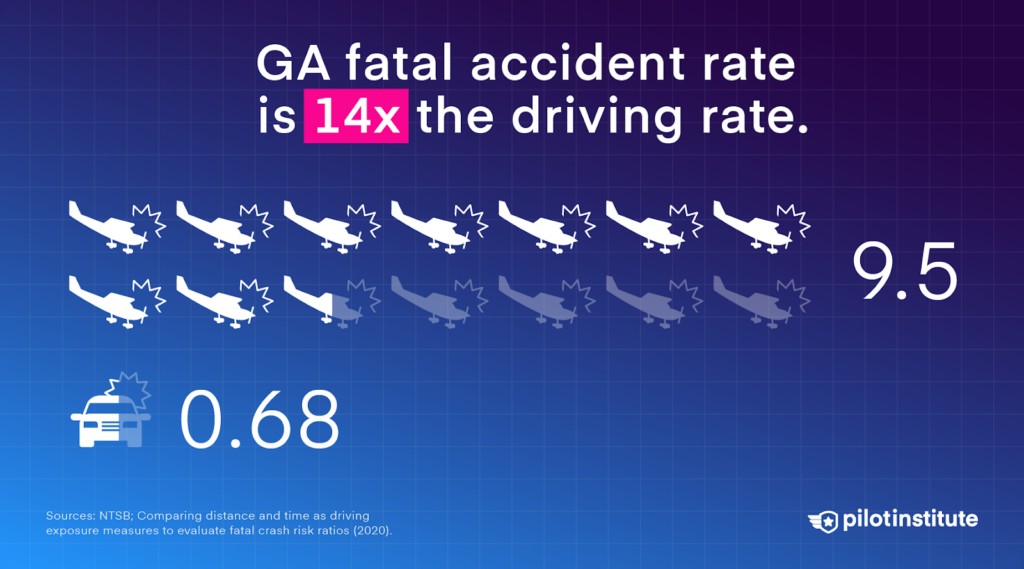 The GA fatal accident rate is roughly 14 times that of driving.
According to the NTSB, there were 0.95 fatal GA accidents per 100,000 flight hours in 2021. This equates to 9.5 fatal crashes per million flight hours, roughly 14 times higher than the driving fatality rate. However, it’s about half the motorcycle rate.
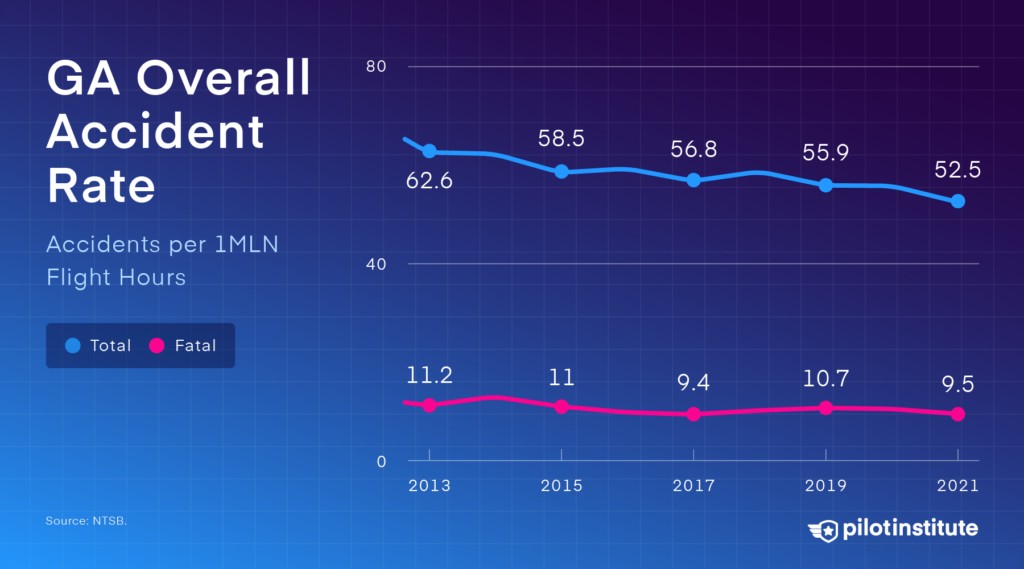 GA overall accident rate: 2012-2021.
Personal Flights: A Closer Look at the Data
General aviation encompasses various types of flying, each with varying degrees of risk. Corporate aviation, for example, is relatively safe, with only 0.48 fatal accidents per million flight hours between 2012 and 2021.
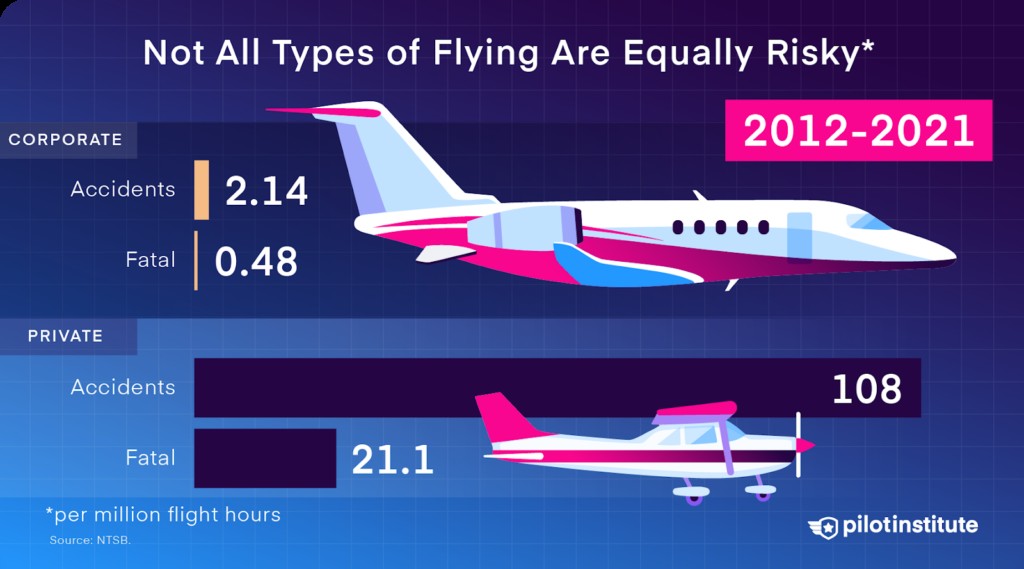 Corporate GA flying is quite safe compared to private flights.
Personal flights, including recreational flying, account for a significant portion of GA accidents and fatalities – 67% of accidents and 72% of fatalities.
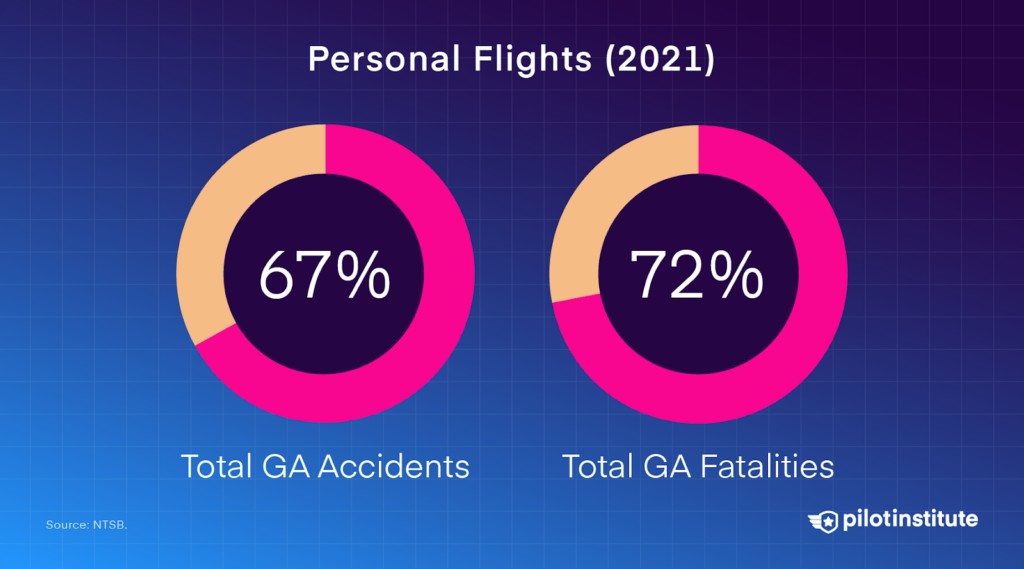 Personal flights account for the majority of total GA accidents and fatalities.
Between 2012 and 2021, personal flights experienced 21.1 fatal accidents per million flight hours. Despite a 24% decrease in fatalities since 2012, this is still over 27 times the driving fatality rate, making it more dangerous than riding a motorcycle.
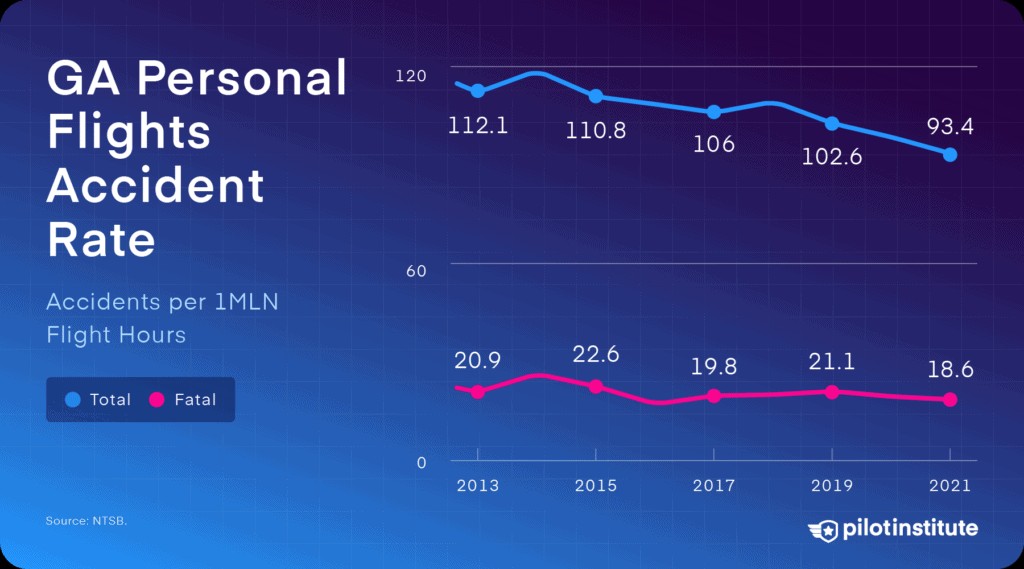 GA personal flights accident rate: 2012-2021.
Instructional Flights: A Safer GA Segment
Instructional flights present a different picture. These flights saw 2.3 fatal accidents per million flight hours, a 52% decrease since 2012. This translates to flight training being only 3.4 times more dangerous than driving.
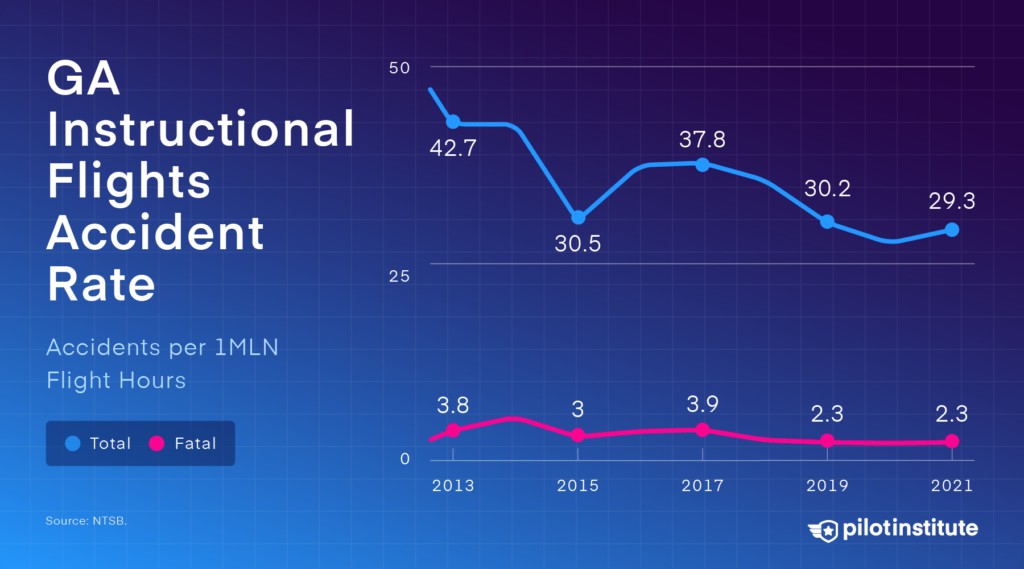 GA instructional flights accident rate: 2012-2021.
Unpacking the Risk Factors in General Aviation
The AOPA’s Richard G. McSpadden Report categorizes accidents into Pilot-related, Mechanical, and Other/Unknown causes.
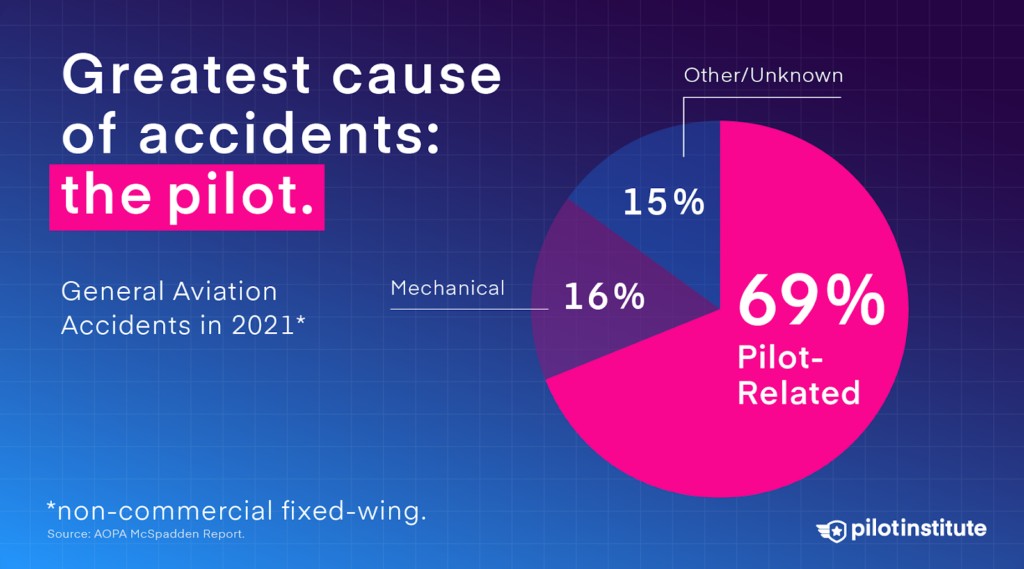 The greatest cause of GA accidents is the pilot.
Unknown Causes
In 2021, 15% of all accidents and 28% of fatal ones had undetermined causes. The inability to pinpoint the cause hinders learning and prevention efforts.
Mechanical Issues
Mechanical failures were the second most common cause, comprising about 16% of all accidents but only 7% of fatal ones in 2021.
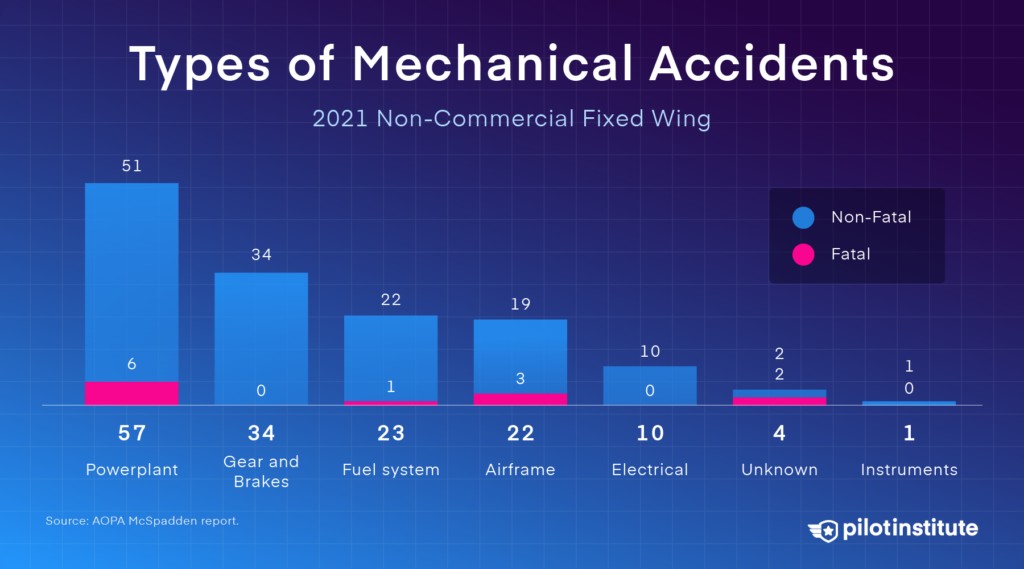 Types of GA mechanical accidents.
Engine failure is a significant contributor to mechanical issues.
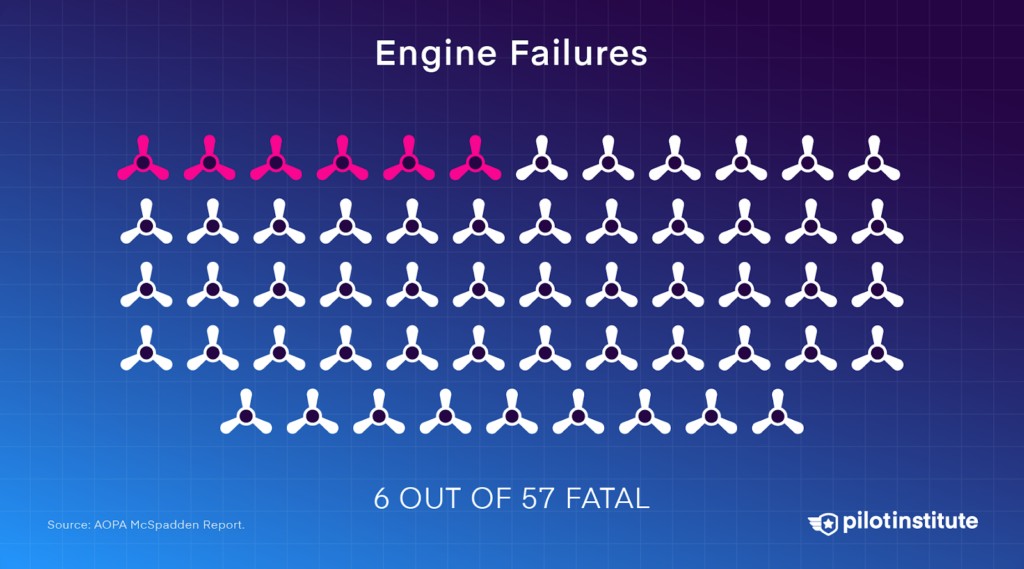 Six out of 57 engine failure accidents in 2021 were fatal.
However, only six out of 57 reported engine failures in 2021 were fatal. This suggests that while concerning, engine failures are often manageable emergencies.
AOPA’s analysis reveals that 30% of engine failures lack a clear cause, while maintenance issues contribute to 16%, and structural failures to 17%. Preventable issues, like carb ice or fuel mismanagement, account for the rest.
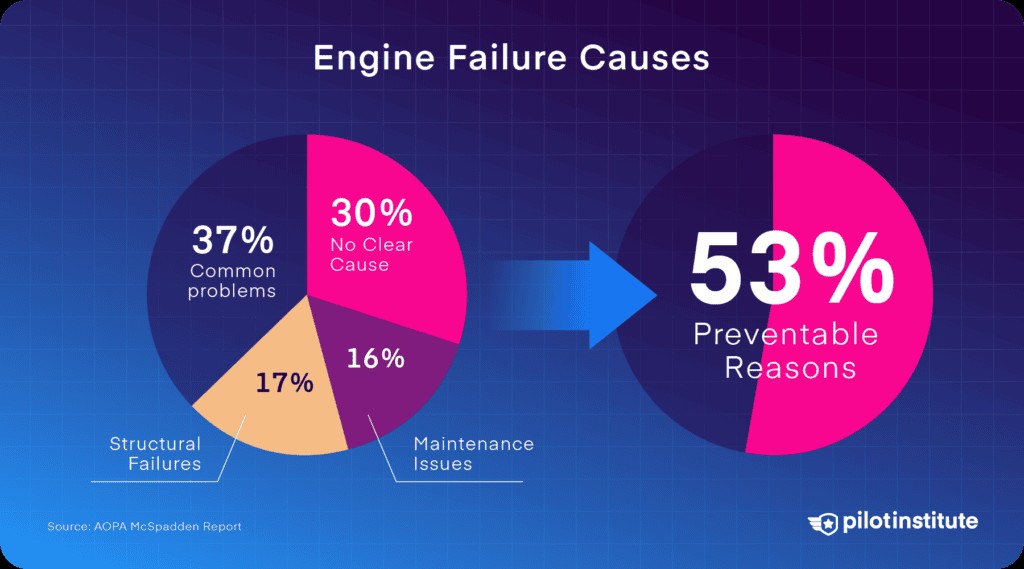 A diagram depicting the reasons for engine failures.
Pilots and mechanics contribute to approximately half of all engine failures, highlighting an area for improvement.
Fuel-related accidents are another area of concern. These typically involve fuel contamination, fuel starvation (due to incorrect fuel selector settings), or fuel exhaustion resulting from poor flight planning.
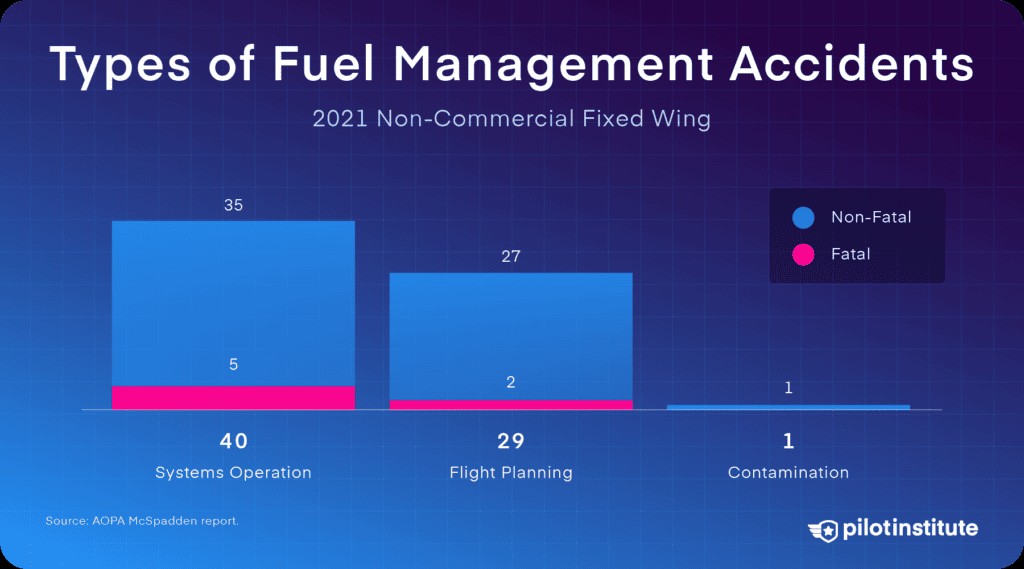 Types of GA fuel management accidents.
The Human Factor: Pilot-Related Accidents
Human factors remain a leading cause of accidents in general aviation. In 2021, the pilot was deemed at fault in 69% of all GA accidents.
The NTSB categorizes these causes as “defining events.”
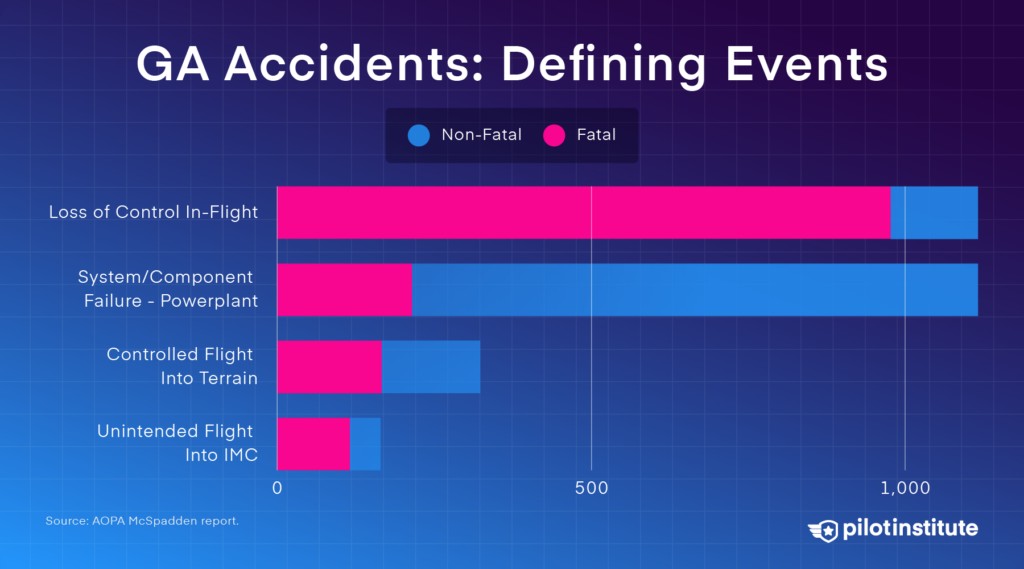 A selection of GA accident defining events.
Loss of control in-flight (LOC-I) is the most common and most fatal defining event.
Loss of Control In-Flight (LOC-I)
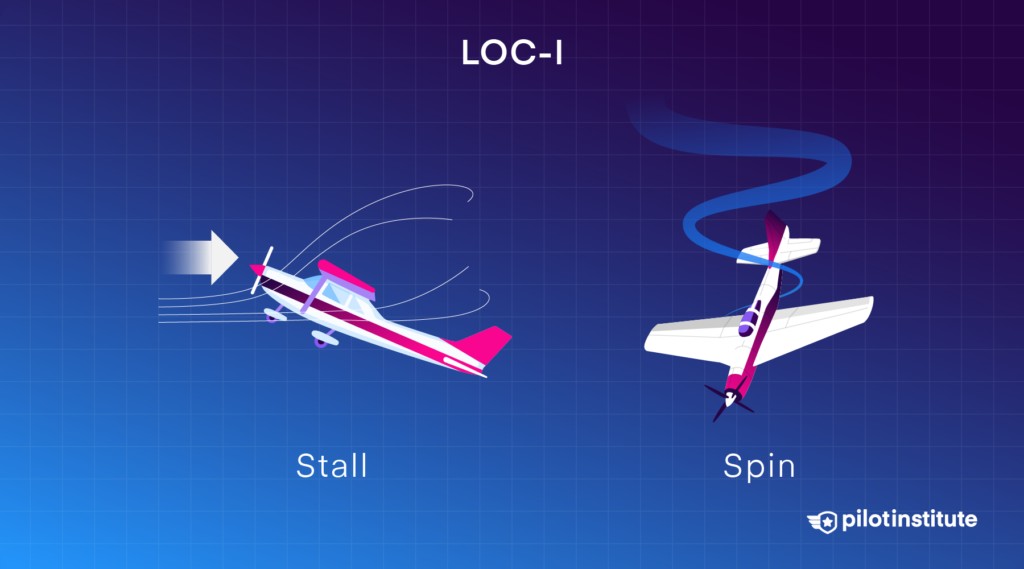 Loss of Control In-Flight: the leading cause of fatal accidents.
LOC-I usually occurs when the pilot loses control of the aircraft due to factors like flying too slowly or making uncoordinated control inputs. Stalls and spins in the traffic pattern during maneuvering flight are common scenarios and often unrecoverable.
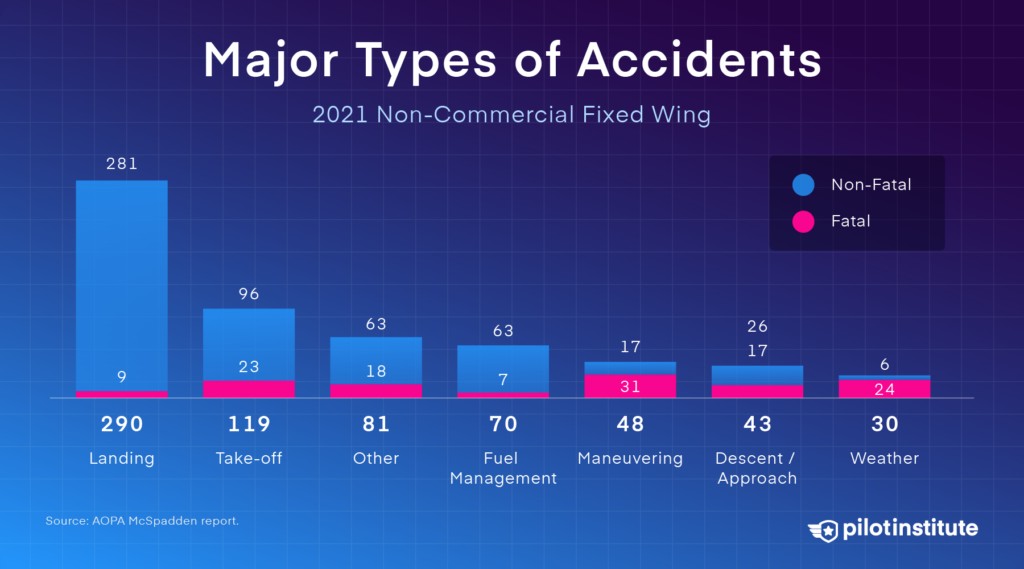 Major types of GA accidents.
Landing Accidents
Landing accidents are frequent but not typically fatal. Loss of control is the most common type of landing accident.
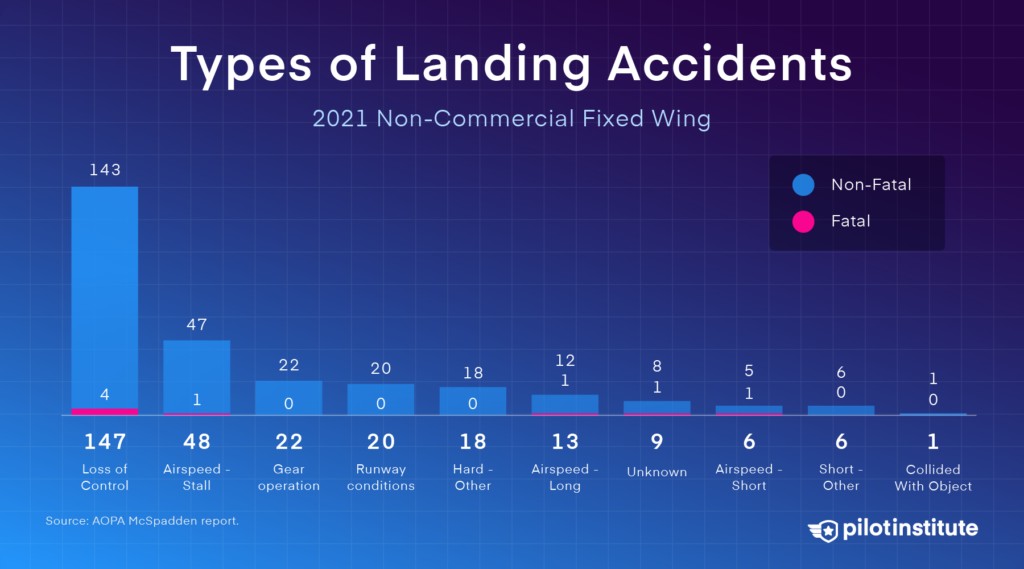 Types of GA landing accidents.
Takeoff and Climb Accidents
Takeoff and climb accidents tend to have a higher fatality rate. The aircraft’s low-energy, low-altitude state with a high angle of attack leaves little margin for error.
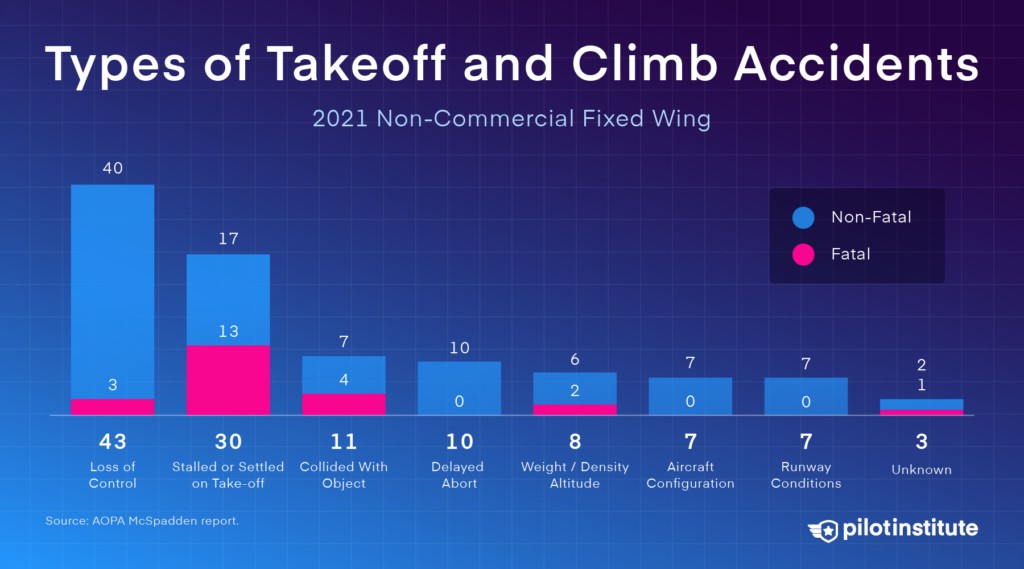 Types of GA takeoff and climb accidents.
Stalls are the deadliest cause of takeoff and climb accidents. Many of these accidents result from attempting the “impossible turn” after an engine failure.
Controlled Flight into Terrain (CFIT)
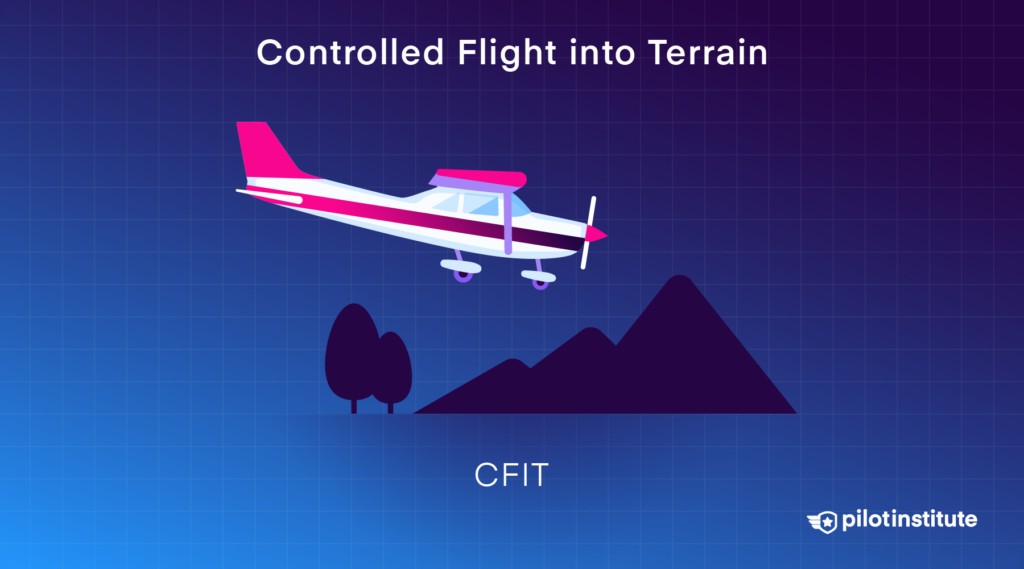 Controlled Flight into Terrain: a top cause of fatal accidents.
Controlled Flight Into Terrain (CFIT) involves an unintended collision with the ground or an obstacle, often due to a loss of situational awareness or descending below minimum altitudes during instrument procedures.
Unintended VFR Flight into IMC
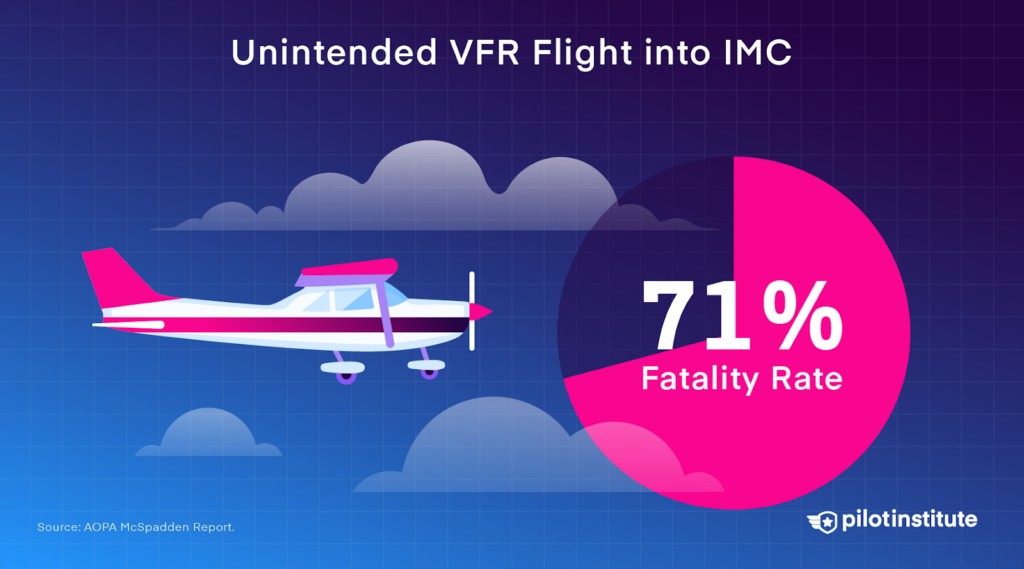 Unintended VFR flight into IMC has a 71% fatality rate.
Flying visually into clouds or low visibility conditions had a 71% fatality rate in 2021.
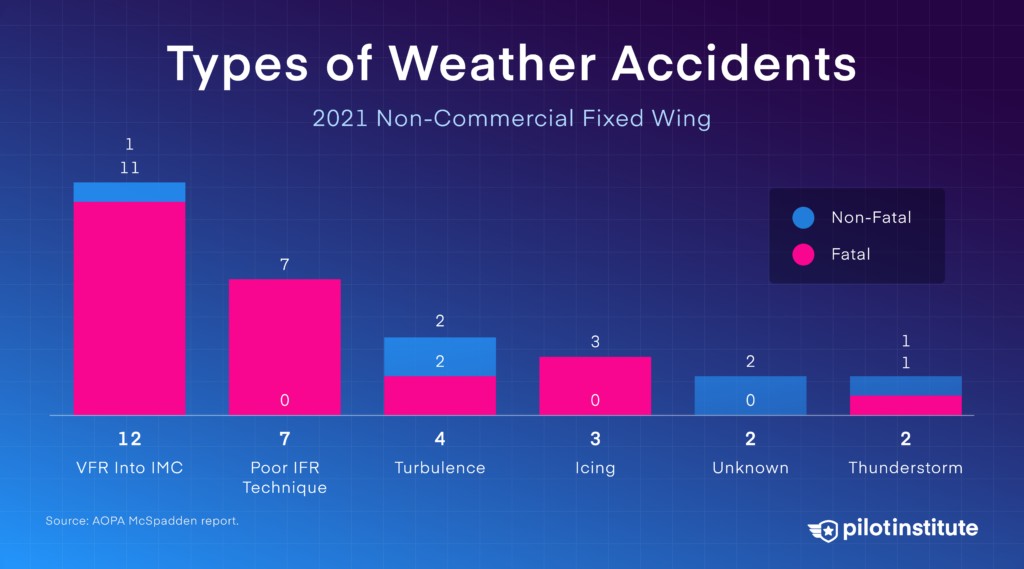 Types of GA weather accidents.
Poor IFR technique and icing conditions also contributed to fatal accidents. Flying in IMC requires a high level of pilot proficiency, and in many cases, canceling the flight is the safest option. Most GA aircraft are not equipped for icing conditions or thunderstorms.
Safety Measures and Best Practices
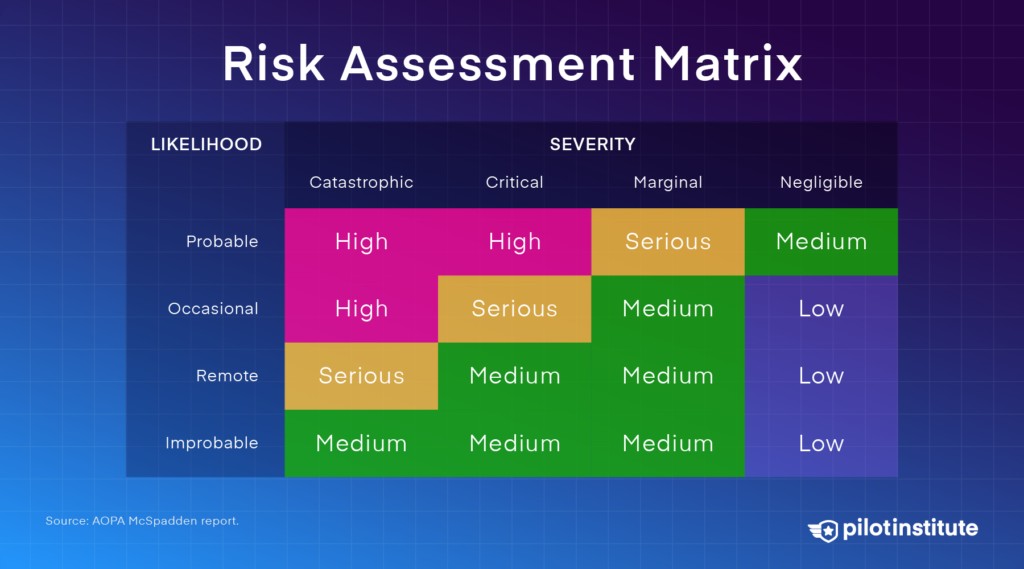 FAA Risk Assessment Matrix.
Instructional flights have a significantly lower fatality rate than personal flights due to several factors:
- Supervised environment
- Structured operations and risk-averse culture
- High aircraft maintenance standards (inspections every 100 hours)
- More proficient instructors
These factors mirror the safety measures in place for airline travel. Airlines operate with highly structured, risk-averse systems, and their pilots undergo extensive training and maintain high levels of proficiency.
GA pilots can adopt a similar safety mindset by prioritizing proficiency over mere currency.
Conclusion: Is Air Travel Safer Than Driving?
While commercial air travel is statistically safer than driving, the same cannot be said for general aviation. Personal GA flights, in particular, have a significantly higher accident rate than driving. However, by understanding the risk factors and implementing robust safety measures, GA pilots can significantly mitigate these risks. As aviators, maintaining discipline, making sound decisions, and prioritizing proficiency are crucial for safe flying.