Since the 20th century, travel has transformed dramatically, offering unprecedented accessibility through motor vehicles and air travel. This evolution has enabled people from all walks of life to traverse vast distances, whether for daily commutes or cross-country journeys. But when considering the various transportation options available, perceptions of safety can often be skewed. Understanding the actual risks associated with different modes of travel is crucial for making informed decisions.
 The Safest Forms Of Transportation
Key Findings at a Glance
- Motorcycles: The riskiest mode, with a fatality rate approximately 24 times higher than car accidents per million miles.
- Cars: High-risk, contributing significantly to daily fatalities and injuries, averaging 102 deaths per day and over five million injuries annually.
- Private Boats: More dangerous than passenger boats, accounting for 90% of boating fatalities.
- Rail Crossings: The primary risk in train travel, with a significant portion of train-related deaths occurring at these points.
- Buses: Lower risk, comprising less than 10% of annual traffic fatalities in the U.S.
- Airplanes: The safest option, with a minimal injury rate per passenger mile.
Airplane Safety: Flying High Above the Risks
It may seem counterintuitive, but commercial air travel stands out as statistically the safest way to travel. Flying in a metal cabin at high altitudes and speeds might appear perilous, but the data tells a different story.
The Numbers Don’t Lie
- The average annual injury rate for air travel is remarkably low at just 0.01 injuries per 100 million passenger miles. To put that in perspective, cars and trucks record 48 injuries for the same distance.
- Notably, there were zero deaths per 100 million passenger air travel miles each year from 2002 to 2020.
- The average annual fatality rate during that period was a mere 0.01 deaths per 100 million miles traveled.
According to airline researchers, based on 2022 flight fatality data, an individual would have to fly every day for approximately 25,214 years to be involved in a fatal accident.
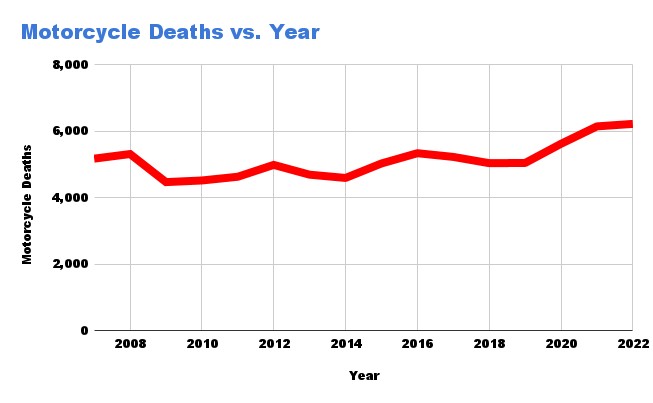 Motorycle death chart
Motorcycle Safety: The Highest Risk on the Road
Motorcycles, offering minimal protection to the rider, unsurprisingly have the highest accident death rate. In 2022, there were 6,222 fatal motorcycle crashes, marking the highest number on record and a 23% increase since 2019. For every million miles traveled on a motorcycle, there are 213 deaths, approximately 24 times the car accident fatality rate. Motorcycles constitute only 3% of registered vehicles but account for 5% of highway-related fatalities.
Car Safety: A Double-Edged Sword
Cars remain the most prevalent mode of transportation. However, the sheer volume of cars on the road translates to significant accident-related statistics:
- Approximately six million car accidents occur annually in the U.S.
- On average, there are 102 fatalities each day due to car accidents.
- One driver fatality occurs every 114 accidents, and one passenger fatality every 654 accidents.
- Over five million car accident injuries occur each year.
- In 2022, there were 42,514 deaths from motor vehicle crashes in the United States.
- Single-vehicle crashes accounted for 53% of these deaths.
While cars are a leading cause of death and injury, the percentage of fatal accidents compared to the total number of accidents is relatively low. In 2022, with 5,930,496 reported motor vehicle accidents, 42,514 were fatal, meaning less than 1% of accidents resulted in death.
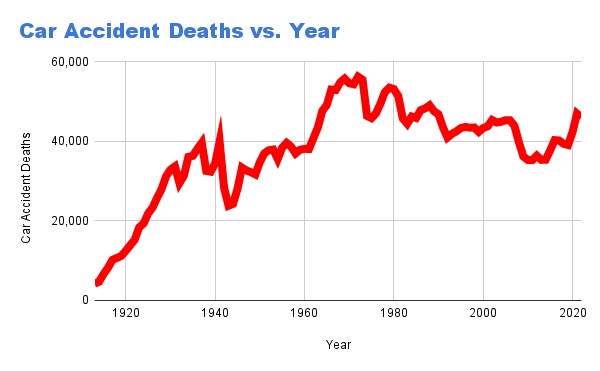 Car accident deaths
Boat Safety: Navigating the Waters
While boat travel was once perilous, it is now safer than ever. Passenger boats such as cruise ships and ferries account for only 10% of boating deaths, while private, recreational boating accidents constitute the other 90%. There are approximately 5,000 boating fatalities in the U.S. each year, or 6.5 deaths per 100,000 registered vessels.
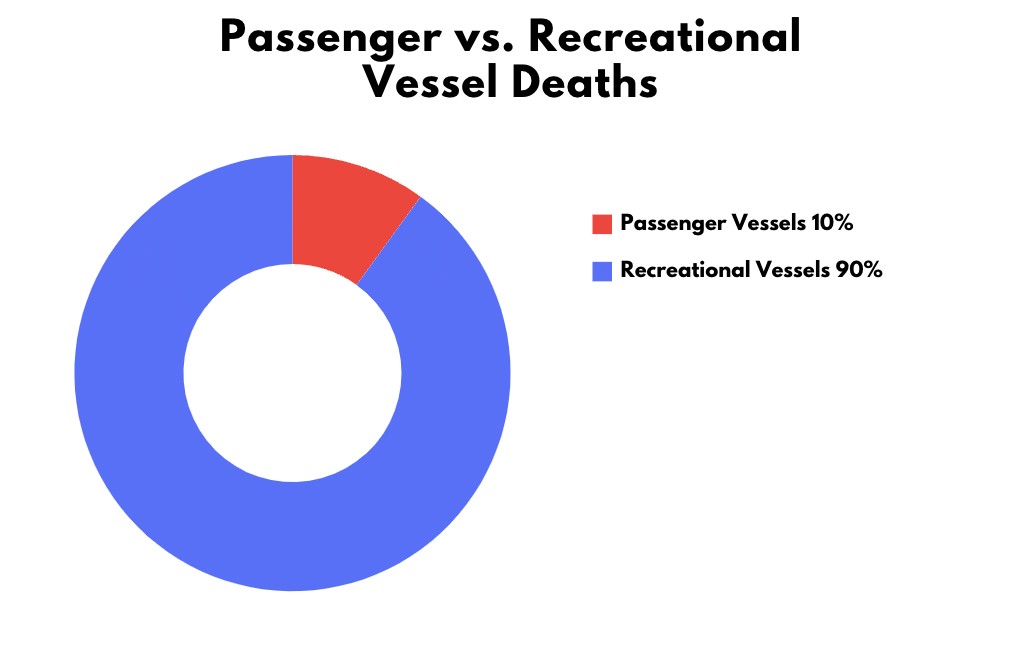 Passenger vs recreational vessel deaths
Train Safety: A Track Record of Safety
Trains have proven to be a reliable mode of transportation over time. Despite occasional headline-grabbing accidents, trains are generally the third safest means of transportation.
Key Train Safety Facts
- There is an average of 1,689 train derailments per year.
- Between 1990 and 2022, 132 people died in train derailments, approximately 4 deaths per year.
- The majority of train injuries and fatalities occur at rail crossings.
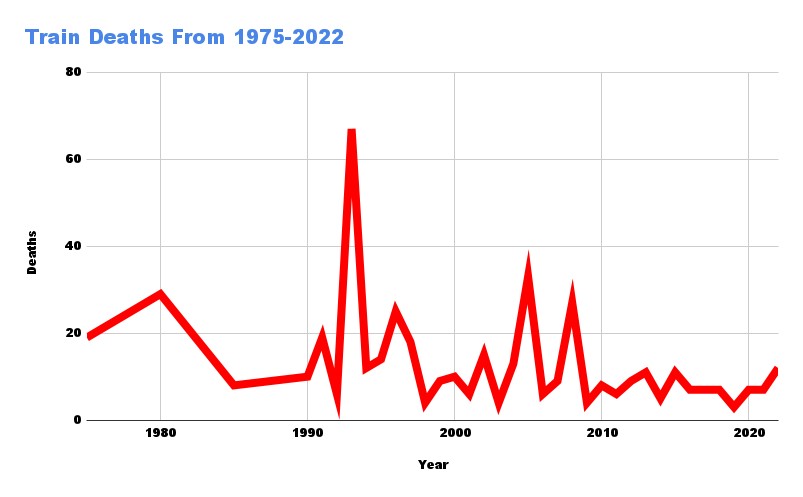 Train deaths
Bus Safety: A Reliable Choice
Stringent safety standards, rigorous licensing requirements for commercial bus drivers, and improved safety features combine to make bus travel the second-safest way to reach a destination. All types of bus accidents comprise less than 10% of annual traffic fatalities in the United States.
Bus Accident Statistics
- There were 15,033 bus accidents in 2022, with 219 being fatal.
- Out of these accidents, 7,119 resulted in an injury.
- 1.5% of bus accidents resulted in a fatality in 2022.
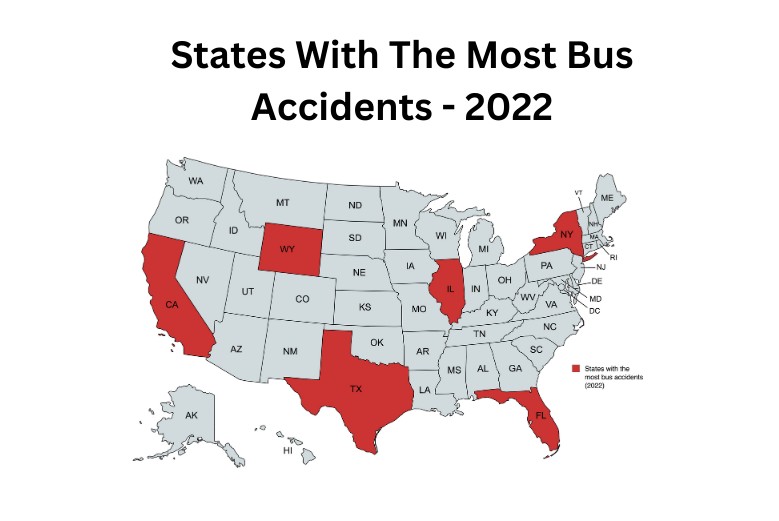 States with the most bus accidents
Making Informed Travel Decisions
Understanding the statistics associated with various modes of transportation empowers travelers to make informed decisions. While commercial air travel emerges as the safest option, it’s crucial to acknowledge the risks associated with other modes, such as motorcycles and cars. Regardless of the chosen method, prioritizing safety precautions remains paramount for protecting oneself and loved ones during travel.