The 20th century witnessed an unprecedented expansion in travel options, transforming how we navigate both local and long distances. From horse-drawn carriages to automobiles and air travel, these advancements have democratized travel for commuters and international travelers alike.
However, perceptions of safety across different modes of transportation can be skewed. Understanding the actual risks associated with each option is crucial for making informed decisions. Let’s delve into the data and statistics to uncover What Is The Safest Way To Travel, ranked from most to least secure.
 The Safest Forms Of Transportation
Airplane Safety: Soaring Above the Risks
Contrary to intuition, air travel is statistically the safest means of transportation globally. Despite the perceived dangers of flying at high altitudes and speeds, commercial aviation boasts impressive safety records.
Unpacking the Statistics
- The average annual injury rate for air travel is remarkably low, at just 0.01 injuries per 100 million passenger miles traveled. This contrasts sharply with car travel, which sees 48 injuries for the same distance.
- Between 2002 and 2020, commercial airlines recorded zero deaths per 100 million passenger air travel miles.
- According to airline researchers analyzing 2022 data, a person would need to fly every day for 25,214 years to be involved in a fatal accident.
While the thought of flying might induce anxiety, the reality is that the probability of serious injury or death is significantly lower compared to other modes of transport.
Bus Safety: A Reliable Ground Option
Buses, including school, charter, city, and airport shuttle buses, represent a safer alternative on the roads. Thanks to stringent safety standards set by the U.S. Department of Transportation (DOT), rigorous licensing requirements for drivers, and ongoing improvements in safety features, bus travel is considered the second-safest method of transportation.
Key Safety Data
- Bus accidents account for less than 10% of annual traffic fatalities in the United States.
- In 2022, there were 15,033 bus accidents, with 219 resulting in fatalities, which equals to 1.5% of bus accidents resulting in a fatality.
- The same year, 7,119 bus accidents led to injuries.
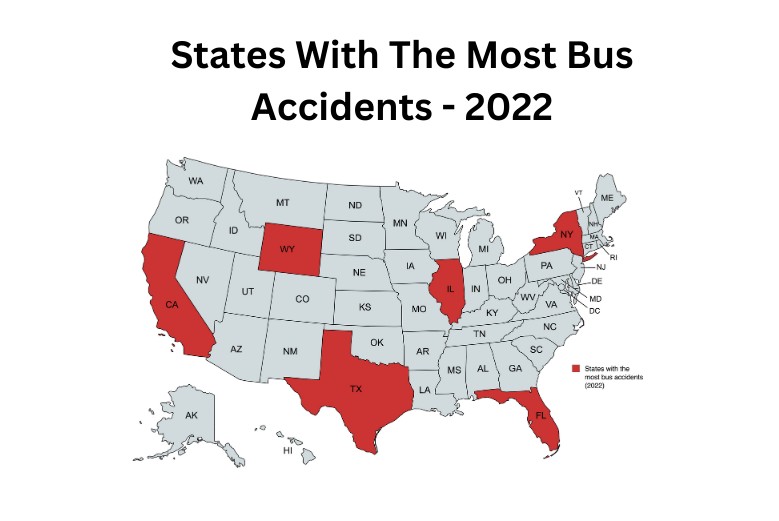 States with the most bus accidents
Train Safety: On the Right Track
Trains have a long history as a reliable mode of transport. Technological advancements have made train accidents relatively uncommon. While any incident tends to attract significant media attention, trains remain the third safest means of transportation, characterized by comparatively low injury and fatality rates.
Important Considerations
- The vast majority of train-related injuries and fatalities occur at rail crossings.
- There is an average of 1,689 train derailments per year.
- Between 1990 and 2022, 132 people died in train derailments – about 4 train derailment deaths per year.
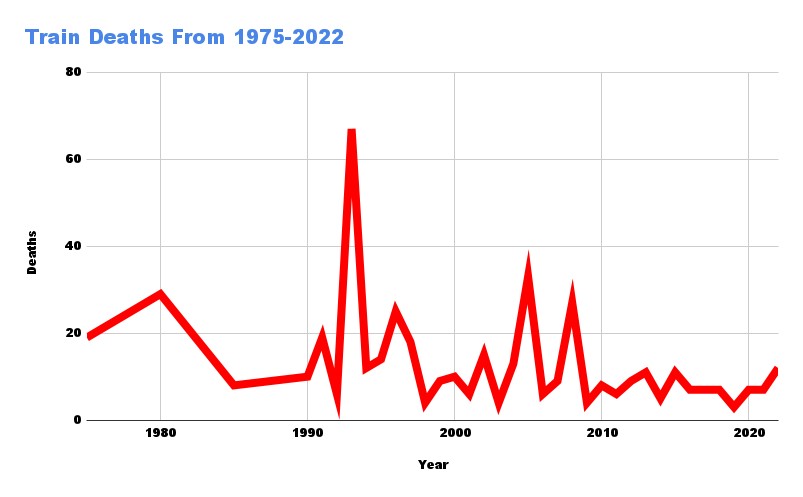 Train deaths
Boat Safety: Navigating the Waters
Historically, boat travel was associated with significant risks. Today, passenger boats like cruise ships and ferries account for only 10% of boating fatalities, whereas private recreational boating accidents make up the remaining 90%.
Safety on the Water
- Annually, approximately 5,000 boating fatalities occur in the U.S., equating to about 6.5 deaths per 100,000 registered vessels.
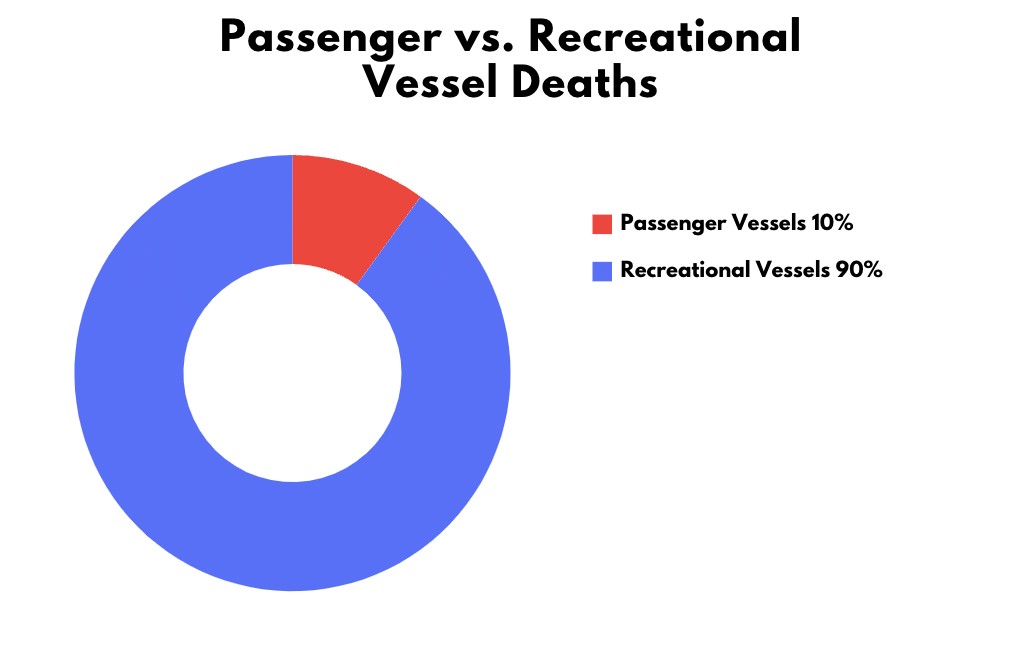 Passenger vs recreational vessel deaths
Car Safety: Balancing Act
Cars are the most commonly used mode of transport, leading to substantial accident-related statistics.
Understanding the Risks
- Six million car accidents occur in the U.S. each year.
- There is an average of 102 fatalities per day.
- Over five million car accident injuries occur annually.
- There were 42,514 deaths from motor vehicle crashes in the United States in 2022, 53% of which occurred in single-vehicle crashes.
- In 2022, there were 5,930,496 motor vehicle accidents reported to the police with 42,514 fatalities, meaning that less than 1% of total accidents were fatal.
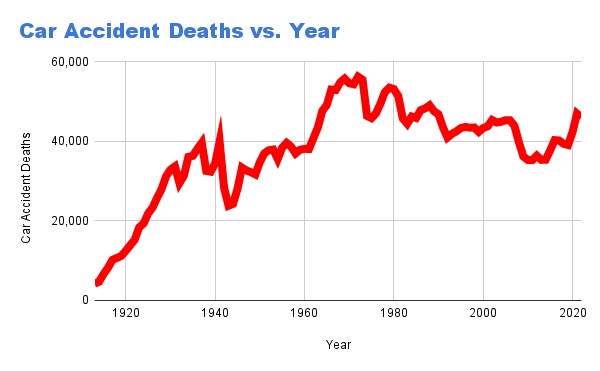 Car accident deaths
Motorcycle Safety: The Highest Risk
Motorcycles offer the least protection to riders, resulting in the highest accident death rate.
The Stark Reality
- In 2022, there were 6,222 fatal motorcycle crashes, the highest on record and a 23% increase since 2019.
- For every million miles traveled, motorcycles record 213 deaths, about 24 times the car accident fatality rate.
- Although motorcycles represent only 3% of registered vehicles, they account for 5% of highway-related fatalities.
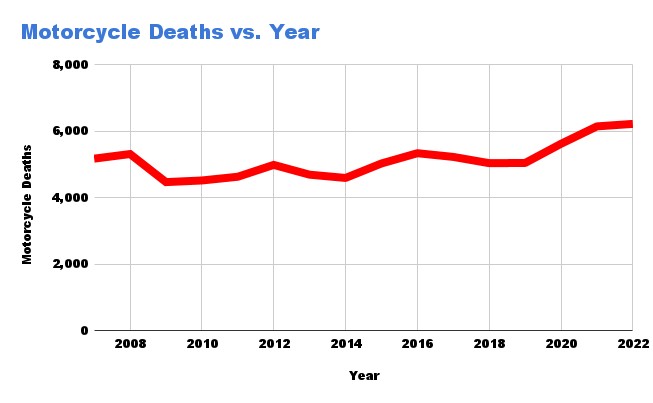 Motorycle death chart
Making Informed Travel Choices
While modern transportation has greatly enhanced our lives, it is essential to recognize the inherent risks. By understanding the statistics associated with each mode of transport, travelers can make informed choices. Whether driving, riding, or flying, always prioritize safety precautions to protect yourself and your loved ones.